Azure Synapse Analytics Develop Hub Data Flow – The Storage of Data

- Log in to the Azure portal at https://portal.azure.com ➢ navigate to the Azure Synapse Analytics workspace you created in Exercise 3.3 ➢ on the Overview blade, click the Open link in the Open Synapse Studio tile ➢ select the Develop hub item ➢ click the + to the right of the Develop text ➢ click Data Flow ➢ and then slide the toggle button next to Data Flow Debug on the top bar, which starts the session. Be patient.
- In the graph area click the Add Source tile in the graph area ➢ in the configuration panel with the Source Settings tab in focus, provide an output stream name (I used Brainwaves) ➢ select Integration Dataset for the Source type ➢ click the + New button to the right of the Dataset drop‐down list box ➢ and then create a new integration dataset (ADLS and Parquet) that points to the sampleBrainwaves.parquet directory created in Exercise 4.7. (Choose only the directory, not the files.)
EMEA/brainjammer/out/2022/04/03/17/sampleBrainwaves.parquet
3. Name the new integration dataset (I used sampleBrainwavesParquet) ➢ select the From Connection/Store radio button ➢ click OK ➢ return to the data flow ➢ click the Data Preview tab ➢ and then view the data. Notice the Timestamp column is in Epoch format.
4. Select the + to the lower right of the Source tile ➢ select Derived Column ➢ enter an output stream name (I used EpochConversion) ➢ the incoming stream should be prepopulated with the source created in step 2 (Brainwaves) ➢ click the Open Expression Builder link ➢ enter a column name (I used ReadingTimestamp) ➢ enter the following into the Expression text box. The expression is available in Chapter04/Ch04Ex07 directory on GitHub at https://github.com/benperk/ADE. Note that 1000l begins with the number 1 and ends with a lowercase L.
toTimestamp(toLong(toDecimal(Timestamp, 14, 4) * (1000l)))
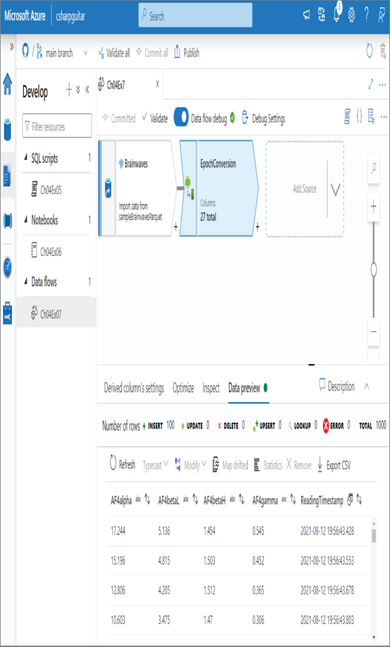
5. Click the Save and Finish button ➢ press the Data Preview tab (see Figure 4.23) ➢ and then click the Commit button to save the data flow.

FIGURE 4.23 Azure Synapse Analytics data flow
In Exercise 4.8 you used some knowledge you learned on how to create an integration dataset. You will be using these concepts and product features more frequently. You also only completed the first phase of this data flow; the final phase is to store the transformed data into a sink. This chapter focuses on the ingestion phase of the Big Data pipeline stages, so that action is saved for later. Before this data flow can be used in a pipeline, a sink (output) must be added to it. See if you can figure it out now, add a sink, configure it, and store it. Note Figure 4.24, which contains all the data flow transformation capabilities, as described in Table 4.4 and Table 4.5.
As you may have noticed, the first item added to the graph canvas is a source. The source is what is configured to retrieve data that will be transformed through the following transformation logic. The items in Figure 4.24 are called transformations. You can see the list of available transformations by clicking the + sign on an existing transformation. When you add a transformation to the data flow graph, an associated configuration panel provides an interface to configure its details.

FIGURE 4.24 Azure Synapse Analytics data flow transformations


